

Last Updated: June 2026
Applies To: Teltonika RUTxxxx Series, Routers
Author: Paul Martin - Forest Rock Technical Support
Understanding RSSI, RSRP, RSRQ, and SINR for Cellular Connectivity
1. Overview
This document provides a structured reference for interpreting 4G and 5G cellular signal metrics. Understanding these values is essential for diagnosing connectivity issues, optimising router placement, and ensuring reliable data throughput. There are four primary measurements used to assess signal health: RSSI, RSRP, RSRQ, and SINR.
2. Why Multiple Metrics Matter
No single measurement provides a complete picture of connection quality. RSSI alone is often misleading because it captures total received power, including noise and interference. A strong RSSI value may still correspond to a poor connection if signal quality metrics (RSRQ, SINR) are degraded.
Example scenario:
RSSI = −70 dBm (signal appears strong)
RSRP = −56 dBm (good)
RSRQ = −16 dB (poor quality due to interference)
SINR = 1.8 dB (borderline usable)
In this case, despite the strong RSSI reading, the poor RSRQ and SINR values indicate actual performance issues, likely caused by interference or physical obstructions between the device and the antenna. Always evaluate all four metrics together.
3. Signal Metric Reference Tables
The following tables summarise the threshold values and performance characteristics for each metric. Colour coding reflects: Green = Excellent, Yellow = Good, Orange = Fair/Poor, Red = Poor/Very Poor.
3.1 RSSI — Received Signal Strength Indicator
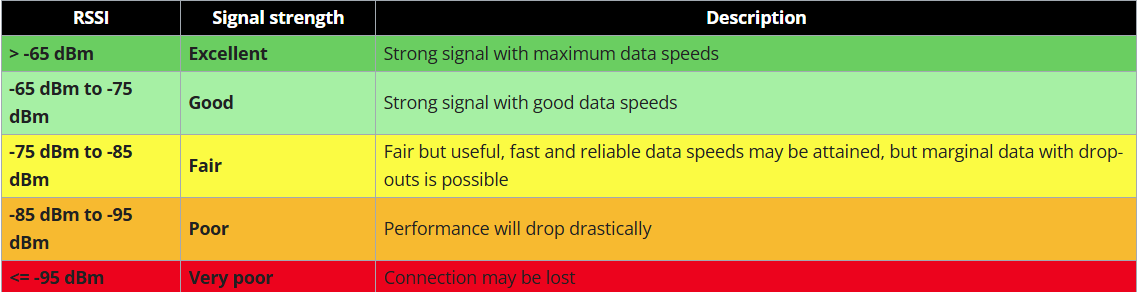
To find the RSSI (Received Signal Strength Indicator) in Teltonika routers, follow these steps:
-
Log in to your router's WebUI.
-
Navigate to the Status section.
-
Select Network.
-
Click on Mobile.3.2 RSRP — Reference Signal Received Power
-
Look for the RSSI value in the relevant measurements section.
The RSSI value is a negative number, with a closer value to zero indicating a stronger signal.
For LTE/4G signal strength, you may also need to check the SINR and RSRP values for a more comprehensive assessment of your network's performance.
3.2 RSRP — Reference Signal Received Power
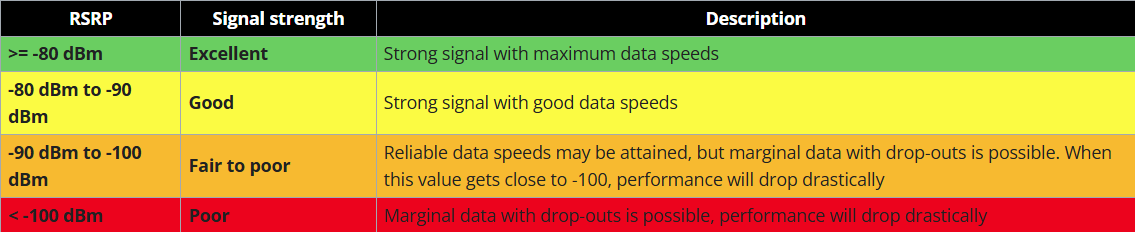
To find the RSRP (Reference Signal Received Power) in Teltonika routers, you can follow these steps:
-
Access the configurator on your Teltonika router.
-
Navigate to the I/O tab.
-
Check the Connectivity Quality element to view the LTE (only RSSI), eMTC, and NB-IoT modes.
-
Convert the value to hexadecimal format and then to decimal format to interpret the RSRP value.
-
The RSRP value will be displayed in a range from 0 to 97, with each value mapped to a specific range of real RSRP value in dBm.
For detailed instructions and visual guidance, refer to the Teltonika Telematics Wiki or the Teltonika Network Setup article.
3.3 RSRQ — Reference Signal Received Quality

To find the RSRQ signal in Teltonika routers, you can follow these steps:
-
Connect your Teltonika router to the network.
-
Open a web browser and enter the router's IP address in the address bar.
-
Log in to the router's admin interface.
-
Navigate to the 'Field Test Mode' section.
-
Look for 'Serving Cell Meas' to find the RSRQ value.
This process will allow you to access the RSRQ signal measurement within your Teltonika router's settings.
3.4 SINR — Signal to Interference plus Noise Ratio

The SINR value for Teltonika routers can be found in the Site Viewer feature of the Teltonika Networks software. This tool allows users to display the SINR for transmitter sites and compute it for receiver site locations on a map. The SINR is calculated based on the power of the incoming signal of interest, interference power from other signals, and some background noise. The Site Viewer supports plotting for antenna sites with a Coordinate System property value of "geographic" and can be used to visualize the SINR values across different locations.
4. Metric Definitions
4.1 RSSI — Received Signal Strength Indicator
RSSI measures the total wideband received power over the full channel bandwidth. This includes the serving cell signal, interference from other cells, and background noise. Because it does not isolate the useful signal from interference, RSSI alone is an unreliable indicator of connection quality in LTE/5G environments. It is best used alongside RSRP, RSRQ, and SINR.
4.2 RSRP — Reference Signal Received Power
RSRP measures the power of the LTE reference signals spread over the full channel bandwidth. Unlike RSSI, RSRP focuses specifically on the reference signal from the serving cell, making it a more accurate indicator of signal strength at the device location. It is the primary metric used by handsets to determine cell selection and handover decisions.
4.3 RSRQ — Reference Signal Received Quality
RSRQ is calculated as RSRP divided by RSSI. It is a carrier-to-interference type measurement, similar to Ec/Io used in 3G networks. RSRQ indicates how much interference and noise is present relative to the useful reference signal. A deteriorating RSRQ value, even with stable RSRP, suggests increasing interference from neighbouring cells or other sources.
4.4 SINR — Signal to Interference plus Noise Ratio
SINR quantifies the throughput capacity of the channel by comparing the strength of the desired signal against combined interference and noise. It is calculated as: Signal Strength ÷ (Interference + Noise). A minimum SINR of 0 dB is required for basic operation; values below this indicate the interference and noise are equal to or greater than the signal itself.
5. Factors Affecting Signal Values
Many environmental and network factors influence the signal metrics described above. These include:
-
Tower load — the number of active mobile users connected to the same base station
-
Proximity to the base station — greater distance reduces signal strength
-
Signal passing through a cellular repeater — may amplify noise alongside the signal
-
Competing signals — interference from neighbouring cells or other RF sources
-
Physical barriers — mountains, buildings, trains, and dense vegetation attenuate signals
-
Weather conditions — heavy rain and atmospheric effects can cause signal degradation
As a result, a device may show excellent RSSI or RSRP but still experience reduced throughput due to high tower load. Signal strength metrics reflect the physical environment, whereas actual data speeds are also determined by network capacity.
6. How to Check Signal Values
To view 4G/5G signal metrics on a compatible RUT router device, log in to the router's WebUI and navigate to:
Status → Network → Mobile
The Mobile window displays live values for RSSI, RSRP, RSRQ, and SINR alongside connection details such as network type (e.g. 4G+ LTE-A), connected band, carrier aggregation status, bandwidth, and data transfer totals.
|
Important Disclaimers
|
7. Quick Reference Summary
|
Metric |
Excellent |
Good |
Fair/Poor |
Very Poor / Very Poor |
|
RSSI |
> −65 dBm |
−65 to −75 |
−75 to −85 |
−85 to −95 / ≤ −95 |
|
RSRP |
≥ −80 dBm |
−80 to −90 |
−90 to −100 |
< −100 dBm |
|
RSRQ |
≥ −10 dB |
−10 to −15 |
−15 to −20 |
≤ −20 dB |
|
SINR |
≥ 20 dB |
13 to 20 dB |
0 to 13 dB |
≤ 0 dB |
Improving signal parameters
Here are the general tips on how to improve the signal parameters:
-
Position the antenna of your mobile router in the best location to receive the strongest signal; this may involve moving it outside of the metal control panel by way of a magnetic or stick on antenna, or closer to a window or outside the building by extending the antenna cable to an external antenna from the selection of antennas available on our web shop:
If you need more help:
Then why not contact our sales or support team.
sales@forestrock.co.uk or support@forestrock.co.uk

Our team can help with antenna selection
4G LTE Antennas - LTE Antenna | Forest Rock
-
Physical obstructions such as buildings, trees, and walls can significantly degrade cellular signal quality. To optimise performance, position the router in a location with minimal interference, ideally elevated and in open space. Avoid placing the router near equipment that can introduce electromagnetic interference, such as variable speed drives (VSDs), large motors, or other high-power electrical devices.
-
Ensure antenna connections on your router are tight and secure; loose connections can degrade the signal.
-
If other options are exhausted, consider switching to a network provider with better coverage in your area and check with our sales team for the best SIM card options for your IoT Projects:
Or they can help you to choose a suitable SIM card for your project
Other Resources & Customer Survey:
💬 Don't miss out! Follow the Forest Rock News channel on WhatsApp Click Here!
💬 We’d also love your feedback! Please take a moment to complete our quick Customer Survey
It only takes a minute and helps us serve you better!

IoT Devices for BMS, Automation & Smart Connectivity | Forest Rock